
eJournal of Tax Research

|
|
Home
| Databases
| WorldLII
| Search
| Feedback
eJournal of Tax Research |
|
Leif Appelgren[∗]
This paper deals with an experiment by the Swedish Tax Agency to test the effect of information to taxpayers regarding different audit strategies[1]. The experiment involved approximately 900 sole proprietors, divided into three groups, where one was informed that audits would focus on taxpayers declaring the lowest income, i.e. according to a rational audit strategy. Another group was told that audits would be made at random whereas the third was a control group. The effect of strategy information was measured as the change in declared income between years. The principal finding was that declared income increased significantly more in the rational-audit-strategy group than in the control group.
Tax audit theory prescribes that the audit risk should decrease with declared income, thus giving the taxpayer an incentive to reduce the fraud amount in order to reduce the risk of detection and sanctions. The objective of this paper is to study whether taxpayers in reality behave as predicted by theory.
Tax audits have a direct effect, i.e. that fraud is detected, resulting in the collection of tax and penalties. The audits also have an indirect deterrent effect, i.e. rational taxpayers are made aware that they may be audited and therefore adapt their behaviour to the expected degree of auditing.
One specific difficulty in the design of audits is in modelling how the deterrent effect depends on the actions of the auditor. A natural starting point is to assume that the taxpayer behaves rationally, in other words, maximizes his expected utility. This approach leads to the model introduced by Gary Becker (1968), which is based on the assumption that a crime is committed if the expected utility of the crime exceeds the expected cost of the sanction.
The Becker model was first applied to tax fraud by Allingham & Sandmo (1973), who used a concave utility function, i.e. one with decreasing marginal utility, in order to determine the optimal amount of fraud when the audit rate is constant and known to the taxpayer. Other applications, which also included the behaviour of the auditor, have been studied by Reinganum & Wilde (1986) and Erard & Feinstein (1994). The theoretical tax fraud models are well described in a survey by Andreoni, Erard & Feinstein (1998).
Reinganum & Wilde (1986) studied the optimal allocation of audit resources to a homogenous group of taxpayers when the cost per audit is given. Such a homogenous group may consist of craftsmen in one-man enterprises or taxi companies with one car. An important assumption is that the only information available to the auditor regarding the individual taxpayer is the declared income. In addition, the auditor knows the distribution of true income, for instance from earlier random audits.
In the model developed by Erard & Feinstein (1994), the cost of an audit is replaced by a constraint that the number of audits is given. The authors also improved the model by introducing the concept of a known fraction of honest taxpayers, i.e. taxpayers who always declare their true income. The remaining taxpayers are assumed to behave rationally. The model has been further developed by Appelgren (2003).
Figure 1: A typical optimal audit-rate function
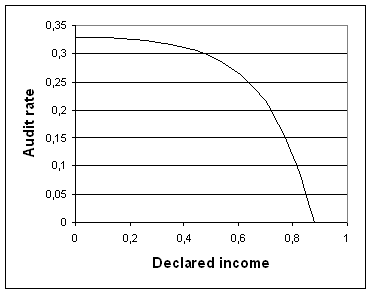
The basis of the models developed by Reinganum & Wilde and Erard & Feinstein is that the auditor observes declared income only and bases his audit decision on this observation. The models lead to an optimal audit-rate function which decreases with declared income, as illustrated in Figure 1.
The effects of information about audit activity have been studied previously in field experiments in Minnesota, USA, the United Kingdom and Australia. The limited number of experiments is probably due to high costs and confidentiality issues involved in the use of actual taxpayer data. In the Minnesota and UK experiments, the effect of tax advisors (paid preparers) is studied since this may have influence on the effect of audit information.
In the Minnesota experiment (Blumenthal et al, 2001), taxpayers were informed that their tax returns would be audited; this led to significantly higher declared incomes for high-opportunity groups (taxpayers with business or farm income) with low and medium incomes. The same effect was not noted for high income earners. A possible explanation for this surprising result is that high-income earners increased their use of tax advisors under the threat of audit, and that those advisors were able to identify legal means for tax evasion, leading to lower declared income.
In the UK experiment (Hasseldine et al, 2007), more than 7,300 small enterprises were studied. They were considered to belong to a high-risk group, with a turnover just below the limit above which a more detailed tax reporting would be required. The companies were divided into six groups, one control group and five groups which received different letters characterised by the terms “Enabling”, “Citizenship”, “Increased audit”, “Audit/penalties” and “Preselected audit”. The principal result was that significantly higher turnover and net profit were reported in the three audit-related groups than in the control group. The monetary profit effects amounted to GBP 176 – 770 in the three groups compared to the control group.
The Australian experiment (Wenzel & Taylor, 2004) was carried out on 9,000 taxpayers in order to measure the effect of a specific form (Rental Property Schedule, RPS) for itemizing deductions made in conjunction with rental property income. The main result of the study was that when the RPS was used to account towards the tax office for the deduction claims, it reduced deductions with 5-7.5%. A mere warning letter or a schedule for personal use only had no effect on cost deductions. The tone of letter was either “soft” or “hard”, where the latter included an audit threat. Overall, the tone of letter had no effect, but it had a positive effect (smaller deductions) on taxpayers who received the RPS for the first time, whereas it had a negative effect on taxpayers who had received the schedule before.
The results in the studies above concerning the effect of audit information are mixed. The effect is clearly positive in the UK study, mainly positive in the Minnesota study and small in the Australian study. A reason for the mixed results may be that the taxpayer has an ex ante assessment concerning the audit risk, and if the audit letter merely confirms this assessment, the effect will be small.
All the models described above assume that the taxpayer is rational and tries to select the amount of tax fraud in order to maximize his expected utility. With an audit rate decreasing with increasing declared income, the taxpayer has an incentive to increase his declared income, i.e. decrease the amount of fraud, in order to reduce the audit risk. In order to obtain this effect, the auditor must inform the taxpayers about the rational audit strategy with decreasing audit rate.
It is not obvious that taxpayers behave as rationally as the theoretical models assume. The scope of this paper is to study whether real-world taxpayers adapt to information about a decreasing audit rate by reducing the fraud amount. More specifically, the main research question is:
Does information about a rational audit strategy with a decreasing audit rate reduce tax fraud as compared to information about a random audit strategy?
This paper concerns an empirical test of the effect of information to taxpayers concerning different audit strategies. The test was carried out by the Linköping Regional Office of the Swedish Tax Agency in 2003-2004 on approximately 900 sole proprietors. The primary objective was to investigate whether information to taxpayers about a near-optimal audit strategy reduces tax fraud compared to information about a more conventional audit strategy, i.e. pure random audits. Information concerning the use of tax advisors/paid preparers was not collected.
The opportunities for tax evasion for individuals with income from employment are limited in Sweden as employers supply the tax authorities with statements on employee remuneration. It is therefore natural to perform an experiment on a group of enterprises. In order to obtain a large homogenous group, sole proprietors mainly in craft trades were selected.
The test was conducted on sole proprietors without employees and with little or no income from employment (maximum SEK 10,000 in the year 2002, where 1 SEK is approximately equal to 0.1 Euro). These owners were supposed to support themselves with their business. Further, the sample was limited to men below the age of 55 in order to concentrate on a high risk group (younger men are more fraudulent than women and older men). The trades included were craftsmen in the building industry, auto-repair craftsmen and hairdressers. Those trades were selected by the Tax Agency as they are the largest groups of sole proprietorships.
According to the theoretical work referred to above, the optimal audit strategy for a homogeneous group of taxpayers is to concentrate audits on those who declare the lowest income. In the experiment, however, the total net cash flow of the household was used instead as the basis for audit selection. Net cash flow is defined as declared income after tax, adjusted for non-cash items like depreciation and allocation to tax allocation reserves, as well as for cash items not included in income such as amortisation and new borrowing.
Three groups were studied, each with around 300 firms.
|
A. Rational Group
|
The members were informed by mail that audits would concentrate on
taxpayers who declare the lowest net cash flow (Appendix 1)
|
|
B. Random Group
|
The members were informed by mail that taxpayers to be audited would be
selected at random (Appendix 2)
|
|
C. Control Group
|
The members received no information
|
The three groups were geographically separated within the region, which encompasses the counties of Östergötland and Jönköping. Without such separation, there might be confusion if two colleagues were to find out that they had received different information regarding the upcoming tax audit.
Information was sent out during the second half of 2003 in order for it to affect the accounting for the remainder of the year and the tax return in May 2004. The Tax Agency expected a possible negative reaction to the audit letters, especially from the Rational Group. Therefore, a service phone number was provided in the audit letters. The Tax Agency registered a total of only 11 phone calls, none of which with negative or critical content.
The effect of the strategy information in the audit letters was measured by comparing declared income for 2003 with declared income for 2002. The hypothesis was that the Rational Group would show a larger increase compared to the Control Group, and that the Random Group would fall between the other two since all information to taxpayers regarding audits is assumed to have a certain deterrent effect.
In the analysis, it was evident that additional delimitations should have been made in the selection of taxpayers. First, firms with income from employment in the year 2003 should have been excluded, in consistency with the exclusion of such firms in 2002. Moreover, a number of firms had used subcontractors extensively, and it can be argued that they should have been excluded like firms with employees.
As Sweden has a loss-carry-forward system, firms showing a loss in 2002 may have had losses in previous years which are included in the 2002 loss. In addition, the result in 2003 includes a carry-forward of the loss shown in 2002. Therefore, firms showing negative income in 2002 should be excluded.
The results reported below refer to data where firms with employment income exceeding SEK 10,000 in 2003 as well as firms with negative income in 2002 have been excluded. Regarding subcontractors, we present results from two sets of data, one excluding firms using subcontractors and one including such firms.
The data set included the Swedish Industry Classification Code (SNI) for each firm. It is evident from Tables 1 and 2 that the construction industry is predominant in the data.
An assumption behind the experiment is that all taxpayers belong to a homogenous group with random variations in income change between years and with randomly varying response to the audit letters. However, an analysis of the distribution of income change (Appendix 3) indicates that the population may consist of two distinct sub-groups, one “honest” group with a smaller standard deviation in income change and a smaller response to the audit letters, and one “fraudulent” group with a larger standard deviation in income change and a stronger response to the audit letters. This sub-group hypothesis has not been taken into account in the analysis below but would be of great interest as a subject for further research.
Table 1. Industry classification of participating firms, excluding firms with subcontractors
|
Industry |
SNI code |
Rational Group |
Random Group |
Control Group |
|
Manufacture of metal products, machinery and equipment |
28, 29 |
0 |
0 |
0 |
|
Demolition of buildings, earth moving |
451 |
6 |
13 |
19 |
|
Construction of buildings etc |
452 |
40 |
54 |
41 |
|
Installation (electric, plumbing etc)
|
453 |
16 |
20 |
13 |
|
Painting, plastering, floor and wall covering, glazing etc |
454 |
39 |
48 |
28 |
Renting of
construction/demolition equipment with operator
|
455 |
4 |
6 |
18 |
|
Auto repair |
502 |
6 |
5 |
8 |
|
Hairdressers |
93021 |
7 |
12 |
15 |
|
Total number of taxpayers |
|
118 |
158 |
142 |
Table 2. Industry classification of participating firms, including firms
with subcontractors Industry SNI code Rational Group
Random Group Control Group Manufacture of metal products, machinery and equipment 28, 29 1 0 2 Demolition of buildings, earth moving 451 16 25 24 Construction of buildings etc 452 71 91 71 Installation (electric, plumbing etc)
453 47 35 30 Painting, plastering, floor and wall covering, glazing etc 454 79 76 65 455 9 8 25 Auto repair 502 12 12 12 Hairdressers 93021 13 22 22 Total number of taxpayers 248 269 251 In the preparations for the experiment, we expected that the standard
deviation in income change between the two years would not exceed
25% of the
average income. If two groups are compared, the standard deviation in the
difference increases by the square root of 2,
i.e. up to 35%. With 300 firms in
each group, the standard deviation of the average income is reduced by the
square root of 300,
i.e. to approximately 2.0%. If a change in audit strategy
would result in a change in declared income by 4%, the change would be
statistically significant at the 5% level. Actual data for the three groups are shown in Tables 3 and 4. The expectation
regarding the standard deviation was apparently wrong,
as the standard deviation
was 35-50% of the average income instead of 25%. Furthermore, the size of the
groups was reduced due to
the additional limitations made above. Therefore, the
difference in income change between groups had to be between 6 and 10% in order
to be statistically significant. Table 3. Average income, average income change and standard deviation in
income change, excluding firms with subcontractors Table 4. Average income, average income change and standard deviation in
income change, including firms with subcontractors The results of a simple statistical test are shown in Tables 5 and 6, where
the hypothesis tested is that two group have the same
mean. The distribution of
the difference in average income is approximately normal with an estimated
standard deviation s calculated from s2 = s12/n1 +
s22/n2 where si and ni are the sample size and
the estimated standard deviation of the compared groups, respectively. In the Subcontractors Excluded case, shown in Table 5, the
Rational Group shows a larger income change compared to the Control Group,
significant on the 4% level. This
indicates that information concerning the
“near-optimal” audit strategy has had the intended effect of
reducing tax fraud
and thereby increasing declared income. In regard to the income change, the Random Group falls between the two other
groups. However, the Random Group does not show a significantly
higher income
change than the Control Group, nor does it show a significantly lower income
change than the Rational Group. The groups
have thus been too small to permit
any clear conclusions as to whether the results are due to the effect of
information in general
or to the effect of information on the near-optimal audit
strategy. For the case of Subcontractors Included (Table 6), no significant
income changes have been obtained, probably because those groups are less
homogenous and therefore show
larger standard deviations. From Tables 5 and 6, we find that the monetary effect of the rational
strategy compared to the control group is SEK 7,900 –
13,800. This can be
compared to the results of the UK study (Hasseldine et al, 2007), where the
effect of the three audit letters,
converted to Swedish currency, amounted to
SEK 2,600 – 11,500. Thus the effect is of the same order of magnitude.
The data supplied by the Tax Agency also included profit before depreciation
and other tax allocations. This measure of income should
be closer to the
“true” result of the business since it is not affected by the
adjustments that the taxpayer can make
in order to reduce his tax burden or show
a smoother income pattern over time. This measure is also closer to the
net-cash-flow measure
used for audit selection in the Rational case. The Swedish tax system allows for two main instruments for income tax
management. First, tax depreciation is very liberal for machinery
and equipment
with up to 20% depreciation on cost or 30% depreciation on depreciated value.
Second, 25% of income may be allocated
to a tax allocation reserve and retained
there for a six–year period. The most striking difference compared with the income measure used in Tables
3 and 4 is much larger standard deviations in profit
change between years, SEK
100,000 – 180,000 as compared to SEK 50,000 – 77,000 in Tables 3 and
4. This indicates that
tax allocations are actively used to equalize declared
income between years. The highest standard deviations are observed for the Rational Group. This is
due to a few extreme outliers, with negative income changes
exceeding SEK
500,000. Excluding the extreme outliers, statistically significant differences
between the Rational Group and the Control
Group are found at the 5% level for
subcontractors excluded as well as included. When subcontractors are included,
the Rational Group
is even found to be significantly better than the Random
Group. In addition to the tests above, using the average income/profit increase
between years, we have also studied the median of the income/profit
increase
since this parameter is independent of extreme outliers. In three of the four
cases, the Rational Group is significantly
better than the Control Group, thus
the results are quite similar to those obtained from using the increase in
average income/profit.
Comparisons have been drawn for the three groups in eight combinations
(average/ median, income/profit, with/without subcontractors).
In addition, the
average profit case has been studied with and without extreme outliers. Thus,
ten cases in all have been evaluated.
In nine of these, the ordering of the
three groups was as expected, i.e, with the greatest changes between years for
the Rational
Group and the smallest changes for the Control Group. Table 7. Significance level for eight tests Significance level Rational Group vs Control
Group Rational Group vs Random Group Subcontr. Excluded Average income change 3.6% 12% Average profit change, extreme outliers excluded 3% 45% Median income change 12% 25% Median profit change 5.0% 91% Subcontr. Included Average income change 18% 35% Average profit change, extreme outliers excluded 0.4% 0.7% Median income change 1.9% 13% Median profit change 1.0% 19% In six of the eight cases, the income/profit increase was significantly
larger for the Rational Group than for the Control Group.
In view of the limited
volume of data in the study, however, it cannot be determined with statistical
significance whether this result
is due to the quality of the rational audit
strategy or to the audit information in general. The selected method of measuring changes in tax-fraud behaviour by changes in
declared income or profit between years, is low in cost
but has several
drawbacks. Income and profit changes may have other causes, such as changes in
business volume, changes in profitability,
investment, sale of assets etc. The
data include several firms with zero sales in one or both years, those firms
were not excluded
as the low declared sales volume may be due to large-scale
fraud. A better measure of fraud would possibly be obtained with random audits but
this method is much more costly. As shown below, random
audits were made in the
Random Group, but unfortunately not in the other groups. It should be remarked
that audits do not discover
all fraud, especially not hidden income which is
kept out of the accounts. The quality of the study may have been affected by the use of net household
cash flow as a parameter for the audit strategy when the
effect of the strategy
is measured as the change in declared income. A taxpayer with a high net
household cash flow, perhaps due
to employment income from his spouse, has no
incentive to reduce any fraudulent behaviour as he does not expect to become
audited.
On the other hand, the incentive works as intended for taxpayers with a
low net household cash flow. The statistical tests indicate strongly that information concerning the use
of rational, “near-optimal” audit strategies
is superior to
information concerning random audits and that audit information is general is
superior to no information. It can be stated with statistical significance that information concerning
the rational audit strategy reduces tax fraud compared
to no information. The results are well in line with the Minnesota and UK experiments. Similar
results should be expected if the study would be repeated
in other countries
where sole proprietors make self-assessments for income tax purposes. . According to Appendix 3, it seems possible that a separation into two
sub-groups provides a realistic model, where one sub-group is
less sensitive to
audit-strategy information (thus less fraudulent) whereas the second sub-group
is more sensitive to audit-strategy
information (thus more fraudulent). In Appendix 4, we find that the indirect effect of changing from random to
rational audits is smaller than the direct effect, contrary
to the experience of
the author. A possible reason is that the audit rate in the study is higher than
normal, resulting in larger
direct effects. As the taxpayer is not informed of
the high audit rate, the behaviour does not change as much as if the taxpayer
had been aware of this fact. It would be desirable to conduct new experiments on a larger scale in order
to obtain statistically significant differences between
the rational and random
groups. It would also be helpful to use more specific information regarding
actual audit rates. Disclosing
such information is against the policy of the
Swedish Tax Agency, however. The hypothesis that the groups consist of two distinct sub-groups, one stable
and less fraudulent and one volatile and more fraudulent,
would be very
interesting to follow up on a larger set of empirical data. Allingham, M.G., & Sandmo, A. (1972). “Income Tax Evasion: A
Theoretical Analysis”, Journal of Public Economics, Vol.1, pp.
323-338. Andreoni, J., Erard, B. & Feinstein, J. (1998). “Tax
Compliance”, Journal of Economic Literature, Vol. 36, pp.
818-860. Appelgren, L. (2003), “Audit Strategies for Tax Fraud Detection and
Prevention”, Paper presented at the Stockholm International Symposium
on Economic Crime, 1-3 December 2003. Appelgren, L. (2006), “Optimal revision – användning av
ekonomiska modeller för ekobrottsprevention”.
In: Nilsson, F. &
Olve, N-G., (eds), 2006. Ekonomiska informationssystem”,
Studentlitteratur, Lund, pp. 175-195. Becker, G. S. (1968), “Crime and Punishment: An Economic
Approach”, Journal of Political Economy, Vol. 76, March-April, pp.
169-217. Blumenthal, M., Christian, C. & Slemrod, J. (2001), “Do normative
appeals affect tax compliance: Evidence from a controlled
experiment in
Minnesota”, National Tax Journal, Vol. 54, pp. 125-138. Eide, E. (2000), ”Oversikt over litteratur om svart arbeid og
skatteunndragelser”, Rapport 6/2000, Ragnar Frisch Centre for Economic
Research, Oslo. Erard, B., & Feinstein, J. S. (1994), “Honesty and Evasion in the
Tax Compliance Game”, RAND Journal of Economics, Vol. 25, pp.
1-19. Hasseldine, J., Hite, P., James, S. & Tuomi, M. (2007), “Persuasive
Communications: Tax Compliance Enforcement Strategies
for Sole
Proprietors”, Contemporary Accounting Research, Vol. 24, pp.
171-94. Reinganum, J. F., & Wilde, L. L. (1986), “Equilibrium Verification
and Reporting Policies in a Model of Tax Compliance”,
International
Economic Review, Vol. 27, pp. 739-760. Wenzel, M. & Taylor, N. (2004), “An experimental evaluation of
tax-reporting schedules: a case of evidence-based tax administration”,
Journal of Public Economics, Vol. 88, pp. 2785-2799. NN Each year the Linköping Regional Office of the Swedish Tax Agency
conducts various activities for purposes of information and
control so that the
tax assessment will be as correct as possible. In some cases we provide advance
notice that a certain type of
control will be carried out. You are part of a
group of randomly selected business proprietors who are being informed at this
early
stage that their income-tax returns to be submitted in 2004 may be
audited. After the tax returns have been filed, we will select the returns be audited.
Your return is one of those subject to a possible special
audit, where we will
select the returns of taxpayers with the lowest net cash flow. In order to determine your net cash flow, we examine the data that you have
provided in your tax return and the remuneration statements
received by the Tax
Agency. We then calculate how much money you have received and how much you have
paid out. The difference between
what you have received and what you have paid
out is your net cash flow. In the enclosure to this letter, you can see a sample
calculation
of net cash flow. If most of the taxpayers in the group have a lower net cash flow than you,
your tax return will not be audited. On the other hand,
if your tax return is
one of those with the lowest net cash flow, it will be selected for audit. There need not be any error in your tax return just because you have a low
net cash flow. But a low net cash flow may be an indication
of unreported
income. This audit concerns your business income. If you also have income from
employment or capital, your tax return may be audited for other
reasons –
in that case there would be no difference between your tax return and all
others. Normally an audit comes as a surprise. We now want to test what happens when
let taxpayers know before they file their tax returns
how we will select which
returns will be audited. We hope that as a result more taxpayers will file
correct returns in the first
place. If you have questions regarding this letter, please call NN at XX. Best regards Bertil Olofson Director, Linköping Regional Office, Swedish Tax Agency NN Each year the Linköping Regional Office of the Swedish Tax Agency
conducts various activities for purposes of information and
control so that the
tax assessment will be as correct as possible. In some cases we provide advance
notice that a certain type of
control will be carried out. You are part of a
group of randomly selected business proprietors who are being informed at this
early
stage that their income-tax returns to be submitted in 2004 may be
audited. After the tax returns have been submitted, we will select the ones to be
audited. Your return is one of those subject to a possible
special audit, where
we will select a number of returns for closer examination on a totally random
basis. This audit concerns your business income. If you also have income from
employment or capital, your tax return may be audited for other
reasons –
in that case there would be no difference between your tax return and all
others. Normally an audit comes as a surprise. We now want to test what happens when
let taxpayers know before they file their tax returns
how we will select which
returns will be audited. We hope that as a result more taxpayers will file
correct returns in the first
place. If you have questions regarding this letter, please call NN at XX. Best regards Bertil Olofson Director, Linköping Regional Office, Swedish Tax Agency The distributions of income change for the Rational and Control
groups in the case Subcontractors Excluded are shown in Figures A3:1 and
A3:2. Is the income change between 2002 and 2003 normally distributed? In a normal distribution, the ratio between standard deviation and the
quartile distance, i.e. the distance between the third and
the first quartile,
is 0.74. In Table A3:1, we compute this ratio for the six cases. It is apparent
that in all cases except Subcontractors Excluded/Rational, the
distribution is far from normal, with extreme outliers causing an abnormally
high standard deviation. A χ2 test for the three cases
Subcontractors Excluded confirms that the distribution is not normal for
the Random and Control cases. A possible approximation of the income change distribution is that each group
consists of two normally distributed sub-groups, one
with a small standard
deviation (narrow group) and one with a large standard deviation (wide group).
The best fit for two normal
distributions has been determined with a
maximum-likelihood model with five parameters (two mean values, two standard
deviations
and one relative weight factor. The results for the case of
Subcontractors Excluded are presented in Table A3:2 below. It is striking that the mean values and standard deviations for the three
narrow sub-groups are so similar. This finding gives rise
to a hypothesis that
the populations consist of two distinct groups, one with stable income from year
to year and one with volatile
income. When information regarding future audits
is supplied, the members of the volatile group respond with an increase in
declared
income, i.e. there is a reduction in fraud. It must be emphasised that the above results are quite uncertain because of
the limited size of the groups. The same results were
not obtained for the case
Subcontractors Included, possibly because those groups are less
homogenous. The Swedish Tax Agency has carried out audits according to its announced
strategies, i.e. on taxpayers with the lowest net household
cash flow in the
Rational Group and randomly in the Random Group. No audits were conducted in the
Control Group. An equal number
of audits were made in the Rational and Random
groups. They resulted in SEK 846,000 and SEK 260,000 respectively in increased
taxes
and tax penalties. Thus the direct effect of a transition from random to
rational audits is SEK 586,000, a strong indicator that
the latter strategy is
considerably more efficient than random auditing. The direct effect should be compared to the indirect, deterrent effect, which
for the case of Subcontractors Excluded is an average income increase
amounting to SEK 10,200 according to Table 7, i.e. SEK 1,204,000 for 118
taxpayers. With the Swedish
local tax rate around 30%, the indirect effect on
public revenues would be about SEK 360,000. The corresponding numbers for the
case
of Subcontractors Included are SEK 5,500 for 248 taxpayers, with a
revenue effect of roughly SEK 410,000. Since the Tax Agency did not exclude taxpayers with subcontractors in the
selection of audit targets, the comparison should be made
with the case
Subcontractors Included. The direct effect of switching from random to
rational audits, SEK 586,000, should thus be compared to the indirect effect of
SEK
410,000. [∗] Economic Information Systems,
Department of Management and Engineering, Linköpings universitet,
Linköping, Sweden. Email:
leif.appelgren@lac.se ∗ . The author would like to thank Lennart Wittberg at the Swedish Tax
Agency for the opportunity to conduct this study and
for valuable assistance in
the analysis. The author also wishes to express his appreciation to Birger Rapp,
Professor of Economic
Information Systems, Linköpings universitet, for
financial support. Finally, the author is grateful to Stig Danielsson, Associate
Professor of Statistics, Department of Mathematics, Linköpings universitet,
for advice and assistance concerning the statistical
analysis. [1] The results have been briefly
described in Swedish in Appelgren (2006)
AustLII:
Copyright Policy
|
Disclaimers
|
Privacy Policy
|
Feedback
Renting of
construction/demolition equipment with operator
Statistical Analysis
The standard deviation of income change
Amounts in SEK 1000
Group
size
Average income
2002
Average increase 2002-2003
Standard
deviation
Relative standard deviation
Rational Group
118
134
27.2
50
37%
Random Group
158
150
17.0
58
39%
Control Group
142
149
13.4
56
38%
Amounts in SEK 1000
Group
size
Average income
2002
Average increase 2002-2003
Standard
deviation
Relative standard deviation
Rational Group
248
154
19.5
77
50%
Random Group
269
164
14.0
55
34%
Control Group
251
157
11.6
54
34%
Testing
Table 5. Data for testing the difference in average
income change between groups, excluding firms with subcontractors
Amounts in SEK 1000
Difference in average income change Δm
Δm/s
Significance
level
Rational Group vs Control Group
13.8
2.10
3.6%
Random Group vs Control Group
3.6
0.55
58%
Rational Group vs Random Group
10.2
1.56
12%
Table 6. Data for testing the difference in average
income change between groups, including firms with subcontractors
Amounts in SEK 1000
Difference in average income change Δm
Δm/s
Significance
level
Rational Group vs Control Group
7.9
1.33
18%
Random Group vs Control Group
2.4
0.50
62%
Rational Group vs Random Group
5.5
0.93
35%
Profit before tax allocations
Median tests
Test summary
Discussion and Conclusions
Method of measurement
Main conclusions
Other results
Further research
Bibliography
Appendix 1: Letter to Members of the Rational
Group
Riksskatteverket (Swedish Tax Agency)
Which returns will be audited?
There need not be any error
Advance notice
Appendix 2: Letter to members of the Random
group
Riksskatteverket (Swedish Tax Agency)
Which returns will be audited?
Advance notice
Appendix 3: Distribution of income change between
years
Figure A3:1. Distribution of income change for the
Rational Group, Subcontractors Excluded
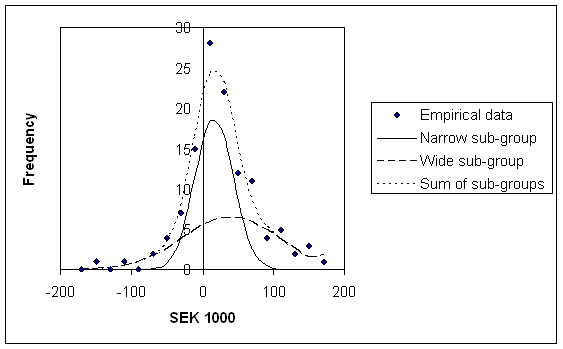
Figure A3:2. Distribution of income change for the
Control Group, Subcontractors Excluded
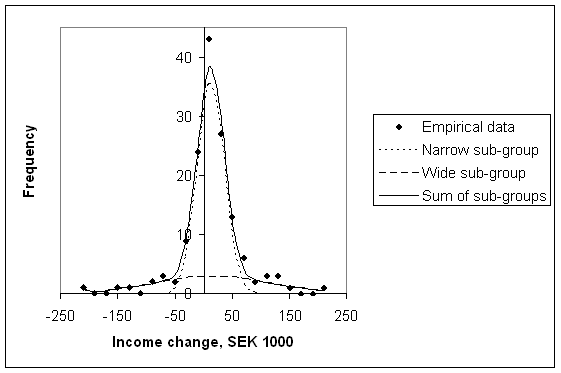
Table A3:1.
Comparison between standard deviation and quartile distance
Amounts in SEK 1000
Group
Standard dev.
Quartile distance
Ratio
Subcontractors Excluded
Rational
50
56
0.89
Random
58
48
1.21
Control
56
36
1.56
Subcontractors Included
Rational
77
56
1.37
Random
55
53
1.04
Control
54
42
1.29
Table A3:2. Maximum likelihood estimates for two
normally distributed sub-groups, subcontractors excluded
Narrow sub-group
Wide sub-group
Amounts in SEK 1000
Mean
Standard deviation
Weight factor
Mean
Standard deviation
Weight factor
Rational Group
16.6
26.2
0.539
39.5
66.1
0.461
Random Group
12.9
21.2
0.678
20.7
93.5
0.322
Control Group
12.9
22.4
0.734
15.7
101.4
0.266
Appendix 4: Direct and indirect effects
URL: http://www.austlii.edu.au/au/journals/eJlTaxR/2008/4.html